The challenge
Coastal marshes at Blackwater National Wildlife Refuge are changing, with marsh giving way to open water. Agencies and planning teams need an initial estimate of where changes are concentrated so they can focus monitoring, field verification, and resilience planning. Consistent comparison of satellite images across years is complicated by image quality, tides, and detection settings.
The question
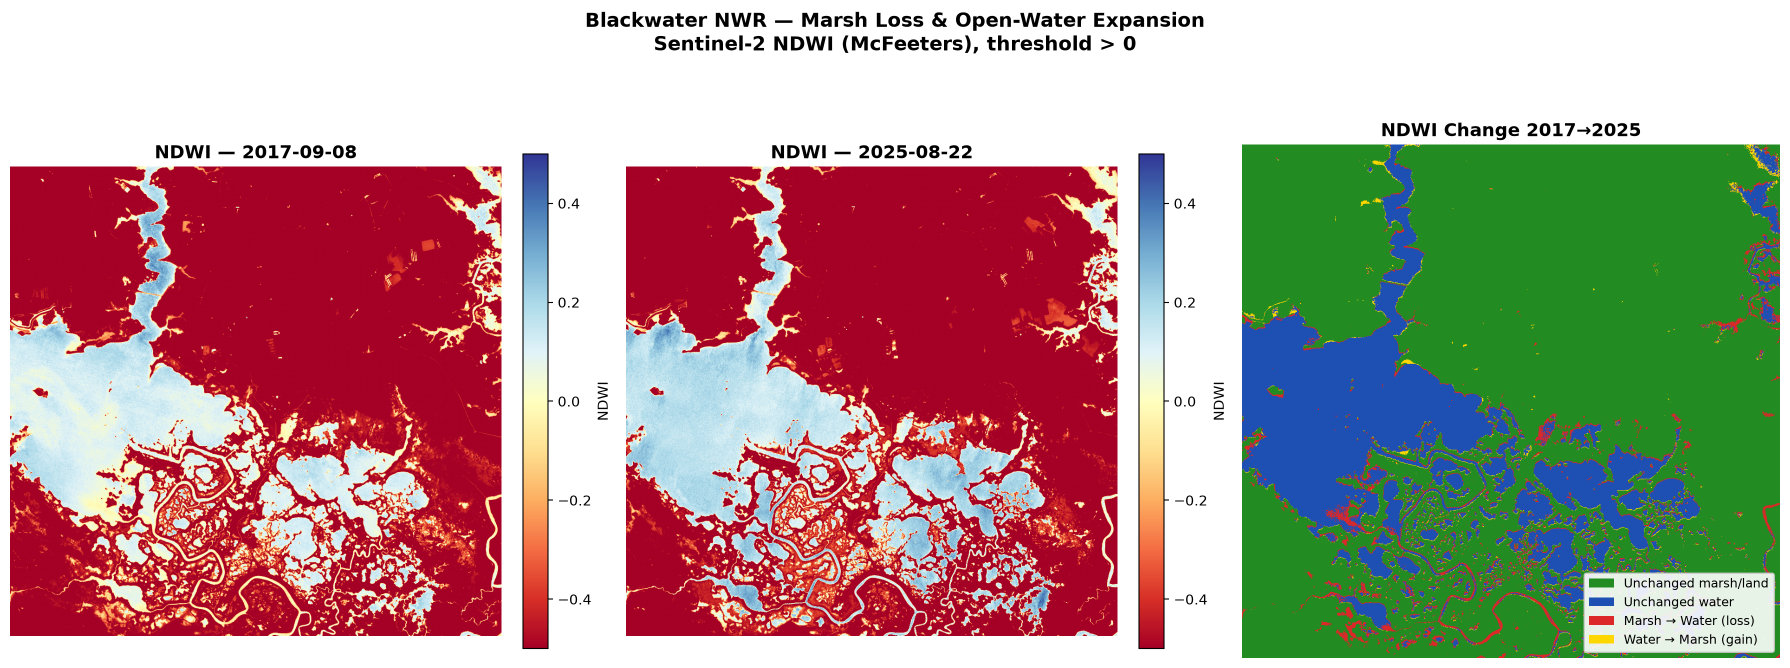
How much marsh appears to have become open water between 2017 and 2025? Compare clear late-summer imagery, map land-to-water and water-to-land transitions, report net change and the five largest loss areas, and describe tidal and image-date limitations.
Approach
Selected clear images
Sentinel-2 images from September 8, 2017, and August 22, 2025.
Mapped open water
Using a standard water index.
Compared changes
Land-to-water and water-to-land changes.
Measured areas
Identified the largest changes.
Documented limitations
Tidal, timing, and detection limitations.
Results
605 acres
Estimated net open-water gain
+10.4%
879 acres
Land that became water
Across 5,379 areas
3.2 : 1
Water gain vs. land return
Approximately 3.2 acres became water for every acre returning to land
Business value
Target field resources
Focus investigation and verification on areas of greatest apparent change.
Inform resilience investment
Support prioritization of restoration and shoreline-management studies.
Communicate risk
Translate satellite observations into maps and findings for decision-makers.
This is an initial estimate, not a field-verified determination of marsh loss.
How we verified the results
- Checked
Open-water totals
Open-water totals were calculated independently, with matching results of approximately 5,812 acres in 2017 and 6,416 acres in 2025.
- Checked
Net change
Land-to-water change (879 acres) minus water-to-land change (274 acres) yields about 605 acres net.
- Confirmed by a person
Study area
The study area was confirmed by a person; settings and field verification still require expert review.